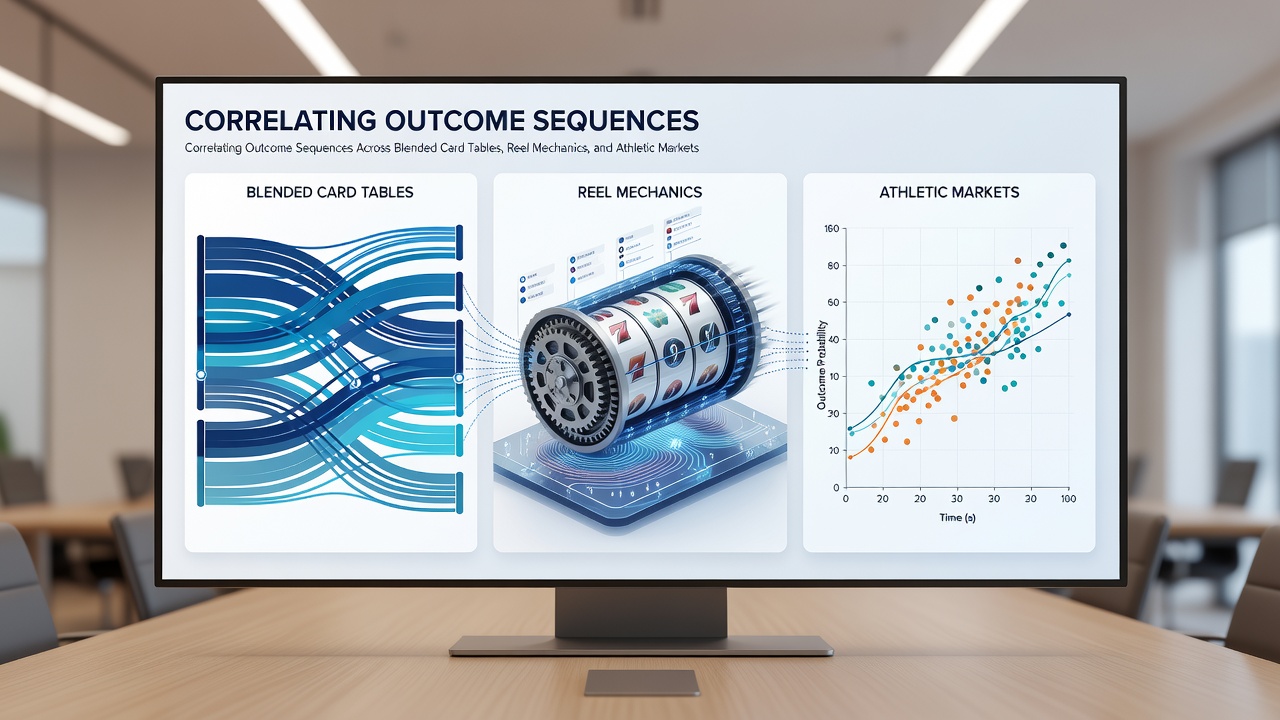
Mapping Outcome Patterns Across Card Games, Slot Systems, and Sports Markets

Analysts have examined how sequences of results unfold in card-based games, mechanical reel systems, and athletic contests, seeking measurable links between these distinct areas of probability and performance data. Researchers apply statistical tools such as Markov chains, autocorrelation functions, and regression models to track streaks, variance clusters, and transition probabilities that appear across these formats, while data sets drawn from licensed operators reveal patterns that repeat under controlled conditions.
Card Table Sequence Structures
Shuffled decks in poker and blackjack produce outcome streams governed by finite card distributions, where depletion effects create dependencies between successive hands that players and observers can quantify through combinatorial analysis. Studies track win rates, bust frequencies, and pair occurrence rates over multi-hour sessions, showing that certain short-term clusters deviate from long-run expectations yet remain bounded by the fixed 52-card matrix. Those who study these tables note that sequence memory persists only until the next shuffle resets the distribution, creating clear breakpoints in the data flow.
Reel Mechanics and Random Distributions
Modern slot systems rely on certified random number generators that generate independent spin outcomes, yet aggregated play logs display volatility patterns and bonus trigger sequences that analysts compare against theoretical return-to-player percentages. Frequency distributions of symbol alignments, scatter appearances, and feature activations form measurable time series when collected across thousands of spins, allowing researchers to identify whether observed runs align with or diverge from expected RNG behavior. Equipment testing laboratories document these metrics during certification, providing baseline data that later studies use when comparing reel performance to other gambling verticals.
Athletic Market Performance Streams
Sports betting markets generate result sequences tied to player statistics, team form cycles, and external variables such as weather or scheduling density, producing data streams that statisticians model through logistic regression and Poisson distributions. Point spreads, total points, and moneyline movements create layered outcome records that evolve during live events and settle into final results, with betting exchanges publishing granular timestamped data that reveals momentum shifts and late-game variance. Observers examining these markets track how consecutive wins or losses cluster around roster changes or travel schedules, generating time-bound patterns distinct from the fixed-matrix constraints of cards or the RNG independence of reels.
Cross-Format Correlation Methods
Researchers combine datasets from multiple verticals to test whether sequence traits observed in one domain predict behavior in another, applying techniques such as cross-correlation analysis and transfer entropy to measure information flow between card outcomes, reel triggers, and sports results. For example, a 2025 study published by the Australian Gambling Research Centre examined whether high-volatility reel sessions coincided with elevated betting volumes on underdog athletic outcomes during the same calendar weeks, finding modest but statistically detectable associations in specific operator samples. Data from the Nevada Gaming Control Board provides parallel records of table game hold percentages alongside sports wagering handle figures, enabling similar multi-domain comparisons within a single regulatory jurisdiction.
July 2026 reports from several North American operators are expected to include expanded sequence logs that cover both digital reel platforms and live sports markets, offering fresh material for correlation testing. Analysts plan to apply machine-learning classifiers to these combined streams in order to isolate any recurring transition states that appear when card session results, reel bonus frequencies, and athletic point totals are examined together. Such work builds on earlier academic papers that modeled gambling outcomes as coupled stochastic processes rather than isolated events.
Conclusion
Sequence correlation work across card tables, reel mechanics, and athletic markets continues to rely on large-scale operator data and standardized statistical frameworks that quantify dependencies without assuming causation. Regulatory archives and peer-reviewed studies supply the primary sources for these comparisons, while ongoing data collection in 2026 will expand the sample sizes available for refined modeling. The resulting insights remain grounded in measurable distributions and transition probabilities that apply uniformly across the examined formats.