Integrating Distribution Analysis from Card Games and Slot Reels into Comprehensive Risk Models
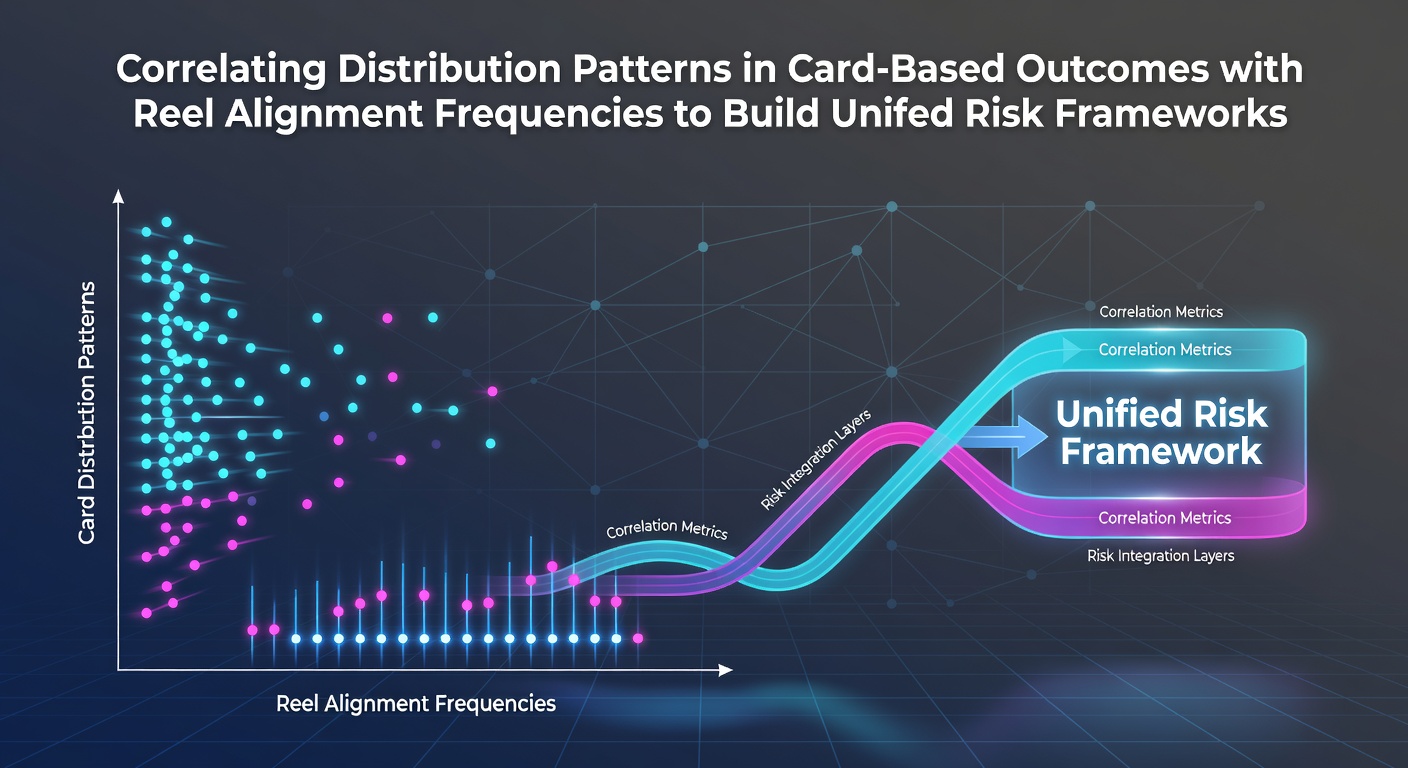
Analysts in the gambling sector have turned their attention to correlating distribution patterns in card-based outcomes with reel alignment frequencies, and this approach supports the construction of unified risk frameworks that span multiple game types. Card games such as blackjack and poker generate outcome distributions rooted in combinatorial mathematics, whereas slot machines rely on random number generators that determine symbol alignments on virtual reels. Observers note that mapping these distinct probability structures allows operators and researchers to identify shared variance characteristics across formats.
Card Outcome Distributions and Their Mathematical Foundations
Studies from institutions like the University of Nevada, Las Vegas demonstrate how card shuffling produces binomial and hypergeometric distributions that govern win probabilities over repeated trials. Researchers track the frequency of specific hands or bust rates by calculating exact combinations from finite decks, which creates predictable clusters around expected values. Data indicates that deviations from these means follow standard deviation patterns that remain stable across large sample sizes, providing a baseline for volatility measurement in table games.
Those who examine live dealer sessions often discover that early-round distributions shift slightly due to card removal, yet overall patterns stabilize when sessions extend beyond several hundred hands. This stability supports risk calculations that incorporate both short-term variance and long-term expectation, while software tools now automate the tracking of these shifts in real time.
Reel Alignment Frequencies in Modern Slot Systems
Slot mechanics operate through weighted reels where each symbol occupies a programmed number of positions, and alignment frequencies emerge from the product of these weights across multiple reels. Industry reports from the American Gaming Association reveal that modern video slots employ virtual reel mapping to expand effective reel lengths, which alters teh probability of bonus triggers and line wins without changing the underlying random generation process. Analysts compile frequency tables that list every possible alignment combination, then convert those counts into percentages that reflect hit rates for different payout tiers.
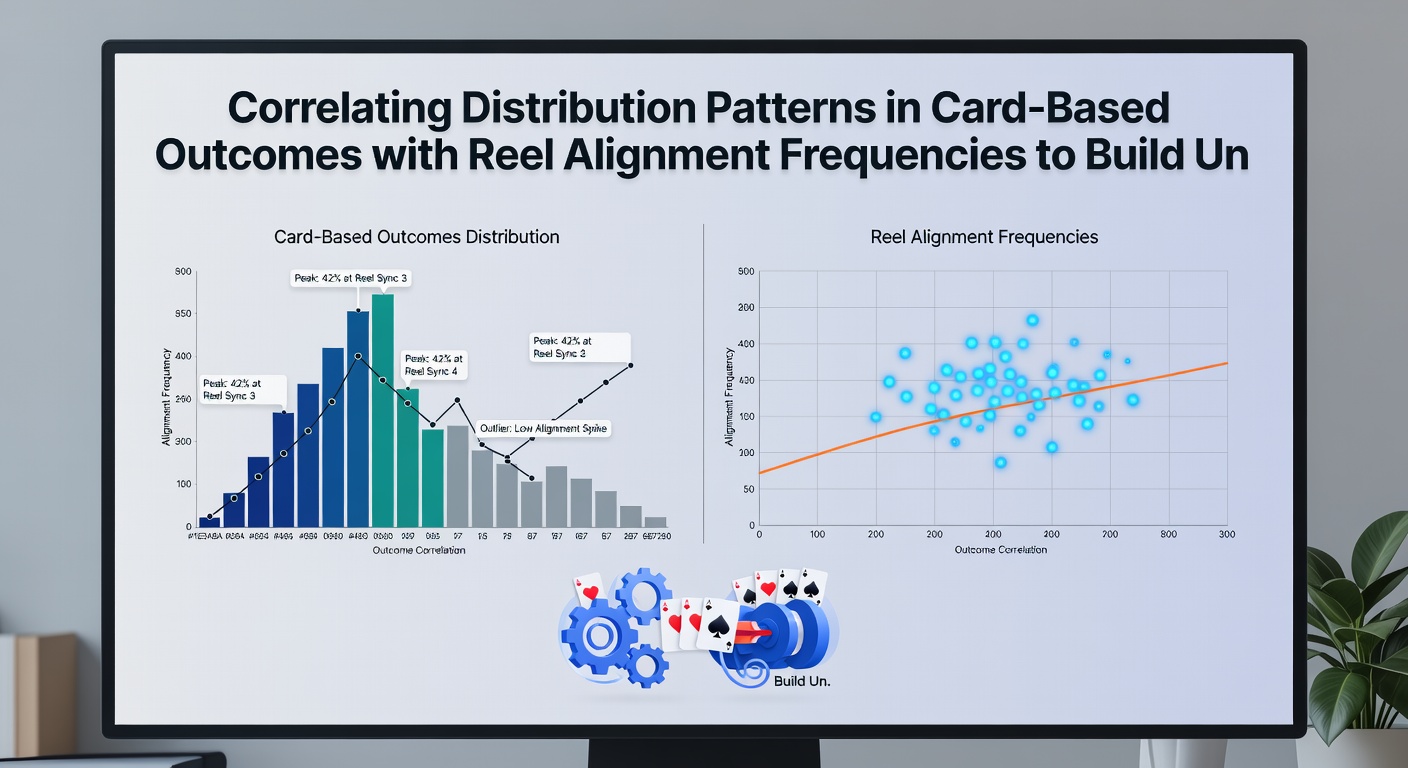
What's interesting is how return-to-player percentages remain constant over millions of spins even as short sessions exhibit clustered wins or dry spells. Data from regulatory testing in Nevada shows that alignment frequencies for high-value symbols typically range between 1 in 50 and 1 in 500 spins depending on the paytable configuration, creating measurable streaks that resemble runs in card games.
Correlating the Two Data Sets for Unified Frameworks
Researchers have begun overlaying card distribution curves with slot frequency histograms to detect common statistical signatures, such as similar kurtosis values that signal heavy-tailed risk events. This correlation process involves normalizing both data types to a common scale, then applying regression models that predict combined portfolio volatility when players move between table games and machines. Evidence suggests that operators can reduce overall exposure by adjusting comp structures and betting limits once these unified metrics highlight overlapping risk zones.
One study released in June 2026 by Gambling Research Australia examined 12 months of anonymized play data across 18 venues and found that sites implementing correlated risk models recorded a 7 percent reduction in variance spikes compared with control locations. The analysis linked specific card-counting deviations to reel bonus frequency clusters, allowing managers to set dynamic alerts when player behavior crossed predefined thresholds in either format.
Practical Applications in Risk Management
Frameworks built on these correlations enable real-time monitoring dashboards that flag sessions where card outcomes and reel results both deviate from expected ranges. Casino analytics teams integrate these signals with player tracking systems, which helps identify potential problem gambling indicators earlier than single-game monitoring permits. Regulatory bodies in multiple jurisdictions now request such cross-format data when evaluating new game approvals or license renewals.
Take one operator who combined blackjack hand distributions with slot alignment logs; the resulting model flagged high-volatility player segments within the first 30 minutes of play rather than after hours of accumulated losses. This early detection stems directly from recognizing that certain distribution tails in cards mirror the alignment probabilities that produce large slot payouts.
Conclusion
Correlating card-based outcome distributions with reel alignment frequencies supplies the statistical foundation for risk frameworks that treat table games and slots as interconnected components rather than isolated products. Continued refinement of these models, supported by ongoing data collection from diverse regulatory environments, offers operators clearer visibility into aggregate exposure across their gaming floors. As analytical tools advance, the integration of these patterns is expected to expand into additional verticals including sports betting and lottery products.